Surface Roughness for Medical Implants: Ra, Sa, Sdr — Measurement Standards and Osseointegration Research
Surface roughness is the single most important quantifiable property of a medical implant surface. It determines whether bone grows to the implant or around it, whether cells differentiate into osteoblasts or fibroblasts, and whether the interface achieves the mechanical stability required for functional loading. Yet the Ra value that most engineers know — the arithmetic mean roughness from a stylus profilometer trace — captures only a fraction of the surface information relevant to biological performance. This guide covers the full parameter landscape: the ISO 4287 profile parameters that drive day-to-day quality control, the ISO 25178 areal parameters that characterize the three-dimensional texture cells actually encounter, the measurement equipment and their respective capabilities and limitations, the cutoff wavelength selections that determine what is and is not included in a measurement, and the clinical evidence base that connects specific roughness values to osseointegration outcomes.
1. ISO 4287: 2D Profile Parameters Explained
ISO 4287 defines the standard profile-based surface texture parameters used in engineering and quality control. These parameters are calculated from a 2D surface profile trace — a single line measurement across the surface using a stylus profilometer or equivalent instrument. The profile is filtered to separate roughness (short wavelength features) from waviness (longer wavelength features) using a Gaussian filter with cutoff wavelength λc.
Ra — Arithmetical Mean Roughness
Mean absolute deviation of the profile from the mean line. Most widely used parameter. Robust, insensitive to isolated peaks or valleys. Most implant surface specifications are expressed in Ra. Does not describe surface texture geometry.
Rz — Mean Peak-to-Valley Height
Average of the maximum peak-to-valley heights over 5 sampling lengths. More sensitive than Ra to isolated high peaks. Useful for surfaces where extreme features (sharp peaks from blasting) matter more than average deviation.
Rq — Root Mean Square Roughness
RMS deviation of the profile from mean line. Approximately 1.1–1.4× Ra for typical surfaces. More sensitive to high peaks than Ra. Used in optics and some precision engineering; less common in implant specifications.
Rsk — Profile Skewness
Statistical skewness of the profile height distribution. Negative Rsk = valley-dominated (more pits than peaks); positive Rsk = peak-dominated. SLA acid-etched surfaces show negative Rsk reflecting the pit morphology. Correlates with cell spreading behavior.
Rku — Profile Kurtosis
Statistical kurtosis of height distribution. Rku > 3: high, sharp peaks; Rku < 3: flat, rounded peaks. Characterizes the sharpness of surface features. Less commonly specified but relevant to cellular mechanosensing.
Rsm — Mean Spacing of Profile Elements
Average spacing between profile peaks. Characterizes surface period/frequency. For SLA blasting, Rsm reflects the mean inter-crater spacing which relates to macro-roughness scale. Not commonly in implant release specs but valuable in process development.
2. ISO 25178: 3D Areal Parameters and Why They Matter
ISO 25178 defines areal (3D) surface texture parameters calculated from a full surface measurement field rather than a single profile line. Areal parameters provide statistically more robust characterization because they sample orders of magnitude more surface features than a single 2D profile trace. For implant surfaces — which have complex, isotropic (direction-independent) topography — areal parameters are more representative of the surface that cells actually interact with.
| Paramètres | Symbol | Définition | Typical Value — SLA Surface | Biological Relevance |
|---|---|---|---|---|
| Areal arithmetical mean height | Sa | 3D equivalent of Ra; mean absolute deviation of surface from mean plane | 1.0–2.0 μm | Primary surface roughness descriptor; correlates with BIC data |
| Maximum height | Sz | Sum of highest peak and deepest pit in measurement area | 10–25 μm | Extreme feature indicator; relevant for particle entrapment risk |
| Developed interfacial area ratio | Sdr | % increase of actual surface area over projected area | 30–80% | Direct measure of available area for protein adsorption and cell adhesion |
| Areal skewness | Ssk | Skewness of areal height distribution; negative = valley-dominated | −0.5 to −1.5 | Valley-dominated (negative Ssk) correlates with better cell spreading |
| Areal kurtosis | Sku | Sharpness of height distribution; Sku > 3 = sharp peaks | 3–5 | Sharp peaks (high Sku) from blasting rounded by etching |
| Material ratio | Smr(c) | Fraction of surface above a given height c | Variable | Bearing area curve; used to characterize load-bearing surface fraction |
Sdr is emerging as one of the most important implant surface parameters in research and is beginning to appear in specification documents. A surface with Sdr = 50% has twice the actual surface area available for protein adsorption and cell adhesion per unit footprint than a flat surface — a biologically significant difference that Ra alone cannot capture. Comparative studies of different implant surface treatments using Sdr alongside Ra provide much more discriminating characterization than Ra alone, and several published meta-analyses of implant surface biology have identified Sdr as a stronger predictor of BIC than Ra in certain surface categories.
3. Measurement Equipment: Stylus, WLI, and AFM
| Method | Standard | Resolution | Parameters | Pros | Cons | Medical Device Use |
|---|---|---|---|---|---|---|
| Contact stylus profilometer | ISO 12179 | Vertical: ~1 nm; Lateral: stylus tip radius (2–5 μm) | Ra, Rz, Rq, Rsk, Rsm (ISO 4287) | Fast; calibrated to traceable standards; robust; affordable | Cannot enter pits smaller than tip radius; risk of surface damage on soft substrates | Standard for production QC; SOP measurement tool |
| White light interferometry (WLI) | ISO 25178 | Vertical: <1 nm; Lateral: 0.5–5 μm (objective dependent) | Sa, Sz, Sdr, Ssk, Sku, Smr (ISO 25178) | Non-contact; 3D areal data; high lateral resolution; fast area measurement | Sensitive to vibration; limited on steeply inclined surfaces; higher cost | R&D and specification development; increasingly in QC |
| Confocal microscopy (optical) | ISO 25178 | Vertical: ~5 nm; Lateral: 0.5–2 μm | Sa, Sdr, Ssk (ISO 25178) | Non-contact; good lateral resolution; can image complex topographies | Slower than WLI; limited scan area; more expensive | Research and failure analysis; specialized QC |
| Atomic force microscopy (AFM) | ISO 25178 (nano) | Vertical: 0.01 nm; Lateral: 1–10 nm | Sa, Sq nano-scale (ISO 25178-7) | Ultimate resolution; nano-scale feature characterization | Very small scan area (μm range); slow; expensive; not practical for production | Research only; nano-roughness characterization |
4. Cutoff Wavelength Selection for Implant Surface Measurement
The cutoff wavelength (λc) is the filter parameter that separates roughness from waviness in ISO 4287 profile measurement. The choice of λc fundamentally determines what is included in the reported Ra value. For implant surfaces, the λc selection must match the biological scale of interest.
5. Osseointegration Evidence by Ra Range
| Ra Range (μm) | Surface Category | BIC at 4–8 weeks | ISQ at Loading | Peri-implant Infection Risk | Representative Treatment |
|---|---|---|---|---|---|
| < 0.5 | Smooth/polished | 20–40% | 55–65 | Faible | Turned/machined surface |
| 0.5–1.0 | Minimally rough | 35–55% | 60–70 | Low–moderate | Acid etch only (no blast) |
| 1.0–2.0 | Moderately rough (optimal for dental) | 55–75% | 65–80 | Modéré | SLA (post-etch); optimal dental range |
| 2.0–4.0 | Rough (orthopedic range) | 60–80% | 70–85 | Moderate–high | SLA (pre-etch or orthopedic); TPS |
| 4.0–10.0 | Very rough | 65–85% (early); bone resorption risk long-term | Variable | High (bacterial harbor) | TPS, heavy blasting, deep etching |
| > 10.0 | Macro-porous (scaffold) | Deep bone ingrowth; BIC measure less meaningful | Slow to achieve; high final | Haut | TPS, additive-manufactured porous structures |
The clinical consensus from multiple systematic reviews is that Ra values of 1–2 μm provide the best balance of early osseointegration performance and long-term hygiene maintainability for dental implants. For orthopedic implants in cementless total joint arthroplasty, the rougher range (Ra 2–4 μm) is preferred because the larger bone contact area and the sealed implant-bone interface (not exposed to oral bacteria) remove the peri-implantitis risk that makes very rough surfaces problematic in the oral environment.
6. Application-Specific Roughness Specification Table
| Application | Ra Specification | Measurement Standard | λc | Instrument Type | Blasting Process |
|---|---|---|---|---|---|
| Dental implant (SLA) — bone contact | 1.0–2.0 μm (post-etch) | ISO 4287 | 0.8 mm | Stylus profilometer | Al₂O₃ 250–500 μm + HCl/H₂SO₄ etch |
| Cementless ortho implant — bone ingrowth | 2.0–4.0 μm | ISO 4287 | 0.8 mm | Stylus profilometer | Al₂O₃ 250–750 μm ± etch |
| Spinal cage — fusion surface | 2.0–6.0 μm | ISO 4287 | 0.8 mm | Stylus profilometer | Al₂O₃ 250–750 μm |
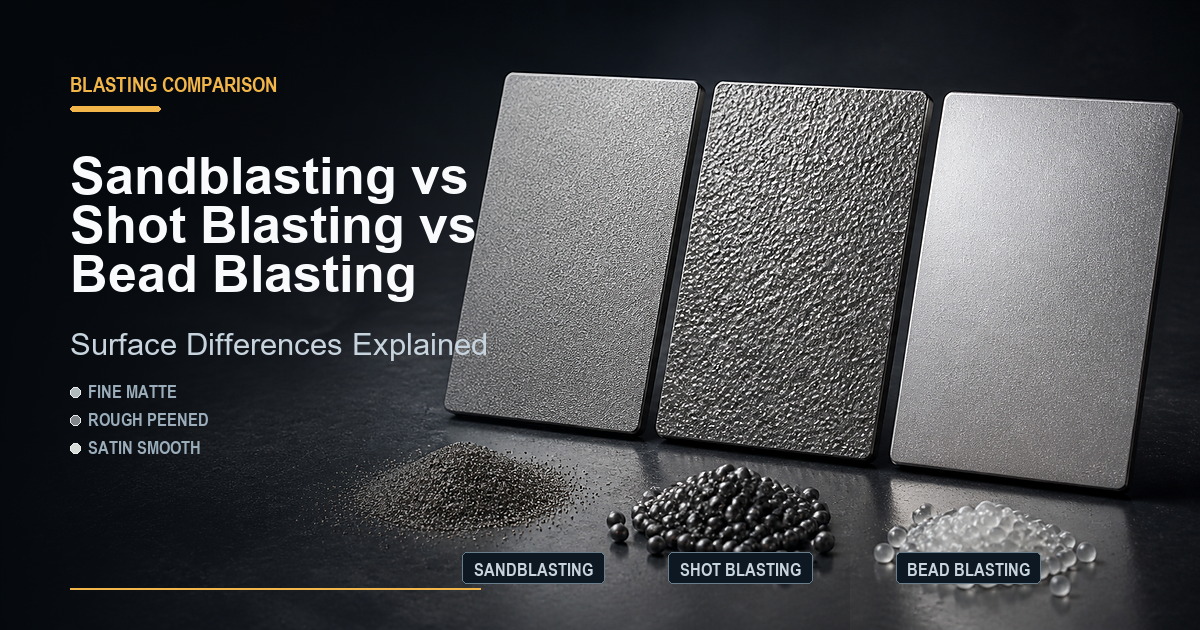
| Surgical instrument — matte finish | 0.4–1.6 μm | ISO 4287 | 0.8 mm | Stylus profilometer | Glass beads #10–#13 |
| Al housing — pre-Type II anodize | 0.8–1.8 μm | ISO 4287 | 0.8 mm | Stylus profilometer | Glass beads #10–#12 |
| Cardiovascular (blood contact, final) | < 0.1 μm | ISO 4287 | 0.08 mm | Optical profilometer / WLI | Electropolishing (not blasting) |
| Ti implant — pre-HA coating | 3.0–6.0 μm | ISO 4287 | 0.8 mm | Stylus profilometer | Al₂O₃ 500–750 μm, 4–6 bar |
7. In-Process Control vs Release Testing Strategy
A practical surface roughness measurement strategy for medical implant production must balance statistical rigor with manufacturing throughput. Two complementary approaches are used in combination:
In-process control: Process parameters (blast pressure, media size, etch temperature and time) are monitored and controlled continuously during production. Deviations from validated parameter limits trigger process stop, investigation, and corrective action before Ra is measured. This approach prevents out-of-specification surfaces from being produced in the first place. Reference coupons (material-equivalent flat samples run through the same process as production parts) are blasted and measured at defined intervals (start of batch, every N parts, end of batch) to verify the process is producing Ra within the validated range.
Release testing: Ra is measured on a statistically determined sample of production implants from each lot before lot release. The sampling plan is defined based on the process capability established in validation (Cpk values for Ra within specification) — a high-capability process with consistent Ra close to target may require only small sample sizes; a lower-capability process requires larger samples. All release measurement results are recorded in the device history record (DHR) per ISO 13485 requirements.
8. Frequently Asked Questions
Ra is a 2D profile parameter (ISO 4287) calculated from a single line trace; it represents the mean absolute deviation from the mean line. Sa is the 3D areal equivalent (ISO 25178) calculated from the full measurement area. Sa is more statistically robust because it samples far more surface features. For complex, isotropic implant surfaces like SLA, Sa characterizes the full texture that cells encounter more accurately than Ra from a single profile line.
λc = 0.8 mm per ISO 4287 is standard for SLA dental and orthopedic implant surfaces, evaluation length 4.0 mm (5 × λc). This captures macro-roughness from blasting (5–20 μm feature period) while excluding waviness. Using λc = 0.08 mm captures only micro-roughness from acid etching. The λc must be stated in the specification to enable reproducible measurement comparison between instruments and laboratories.
Multiple systematic reviews support Ra 1–2 μm (post-etch) as optimal for dental implants. Below 0.5 μm shows significantly lower early BIC. Above 2 μm shows similar or marginally higher early BIC but greater peri-implantitis risk from bacterial harboring on rougher surfaces. The 1–2 μm range balances osseointegration performance with long-term hygiene maintainability.
Sdr (developed interfacial area ratio, ISO 25178) is the percentage increase of actual surface area over projected footprint area. Sdr = 50% means 50% more actual surface for protein adsorption and cell adhesion per footprint unit. SLA surfaces show Sdr 30–80%; polished surfaces below 5%. Sdr is emerging as a stronger predictor of BIC than Ra alone in comparative implant surface studies.
Contact stylus profilometers (ISO 12179) are standard for production QC — fast, calibrated, traceable, produce ISO 4287 Ra. White light interferometers (WLI) provide non-contact 3D areal data for ISO 25178 Sa/Sdr/Ssk, with higher lateral resolution — used in R&D and increasingly in QC. AFM provides nanometer-resolution surface data but is impractical for production due to small scan area and measurement speed.
Source Abrasive Media for Precise Implant Ra Control
Jiangsu Henglihong Technology supplies medical-grade aluminum oxide and glass beads with tight particle size distributions that enable consistent Ra achievement in validated implant blasting processes.
Request Media Specifications & QuoteFiltres