Surface Finish and Ra Values After Ceramic Bead Blasting SLS 3D Printed Parts
Surface finish is the most directly measurable outcome of ceramic bead SLS depowdering, and Ra is the metric buyers and engineers specify most often. This article provides the complete data reference: as-built SLS surface characteristics by build orientation, Ra achieved after blasting across bead grades and sizes, the surface uniformity improvement that matters as much as absolute Ra, a guide to targeting specific Ra values, and Ra consistency over the ceramic bead media lifetime.
1. Surface Roughness Parameters: Ra, Rz, and Rq Explained
Three surface roughness parameters appear most frequently in SLS production quality specifications. Understanding what each measures — and why Ra dominates SLS depowdering QC — prevents misinterpretation of measurement data.
Ra (arithmetic mean roughness) is the average absolute deviation of the surface profile from its mean line, measured over the evaluation length. It is the most widely used parameter for SLS depowdering QC because it is stable, repeatable, and directly correlated with visual and tactile surface quality. Ra is specified in the pillar page and throughout this series.
Rz (mean roughness depth) is the average of the five largest peak-to-valley heights within the evaluation length. Rz is more sensitive to isolated deep valleys or high peaks than Ra. For SLS surfaces with occasional sub-surface voids or particularly high sintering peaks, Rz provides a more conservative safety indicator for applications where extreme surface events matter — coating adhesion on sintered nylon parts, for example, is better predicted by Rz than Ra.
Rq (root mean square roughness) weights outliers more heavily than Ra. It is less commonly specified for SLS depowdering QC but appears in optical scattering models and some medical device specifications. For general SLS production, Ra is the primary specification parameter.
2. As-Built SLS Surface Characteristics by Build Orientation
The as-built surface of SLS nylon parts is not uniform — it varies systematically with build orientation due to the layer-by-layer sintering process. Understanding this starting point is necessary to interpret post-blast Ra data correctly.
| Surface Orientation | PA12 As-Built Ra | PA11 As-Built Ra | Origin of Texture |
|---|---|---|---|
| Horizontal (top, perpendicular to build) | 12–18 µm | 12–18 µm | Cross-section of sintered layer — smoothest as-built face |
| Side / angled (parallel to build direction) | 20–28 µm | 19–26 µm | Staircase effect of stacked layer edges at layer thickness pitch |
| Downward-facing (in-bed bottom) | 16–23 µm | 15–22 µm | Contact with powder bed during sintering; moderate texture |
| TPU (any orientation) | 14–25 µm (Shore A 85–95, all orientations) | Similar staircase effect; compliance adds variability | |
The anisotropy — the Ra difference between horizontal and side surfaces — is typically 8–12 µm on as-built PA12 SLS parts. This difference is clearly visible to the eye: horizontal top faces appear noticeably smoother than angled side walls. On assemblies where different face orientations are simultaneously visible in the finished product, this anisotropy is one of the most common appearance quality complaints from customers receiving unprocessed SLS output.
3. How Ceramic Bead Blasting Modifies SLS Surface Texture
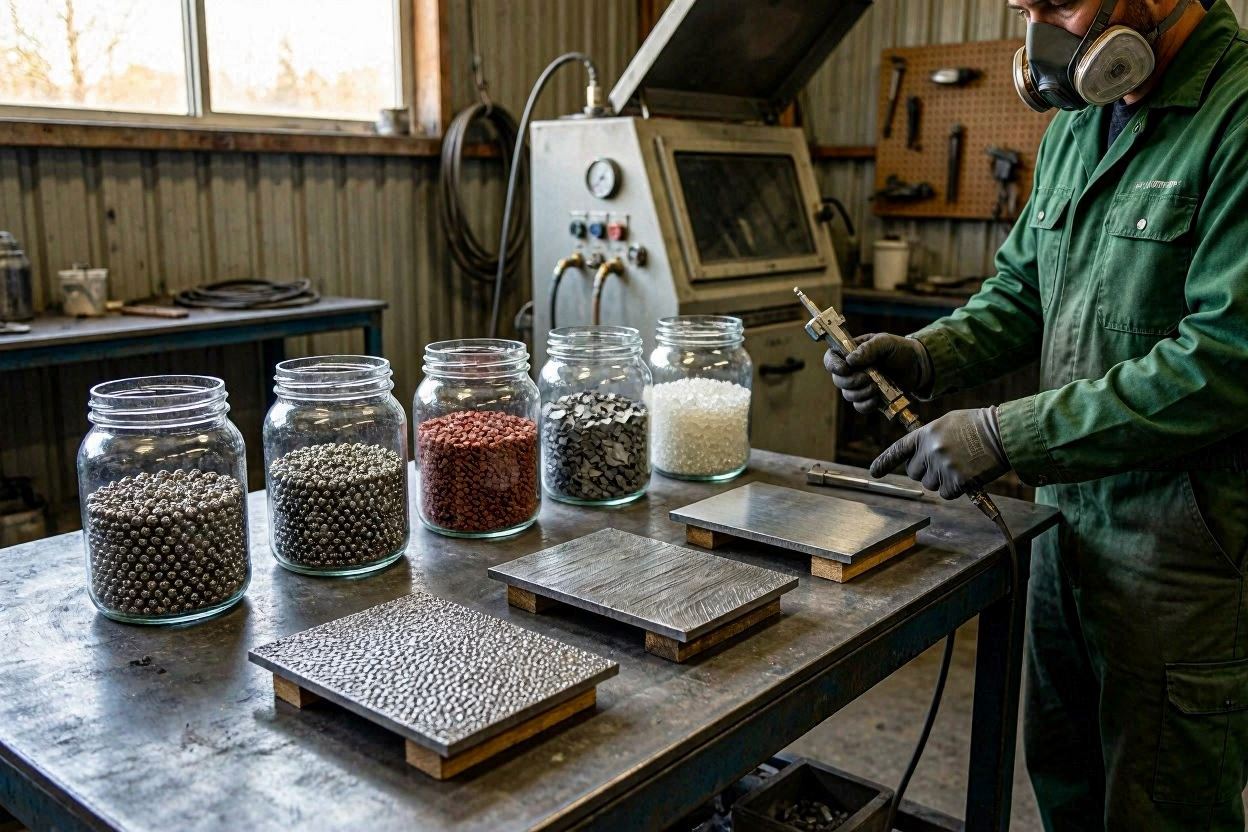
Ceramic bead blasting modifies SLS surface texture through two simultaneous mechanisms. First, the impact force breaks and dislodges the semi-sintered powder skin — removing the outermost heterogeneous layer and exposing the more uniform fully sintered nylon substrate. Second, the compressive peening action of spherical beads deforms micro-peaks on the surface (reducing peak height) and partially fills micro-valleys through plastic deformation of the surrounding material.
The combined effect is a more uniform, lower-amplitude surface texture. Micro-peaks that were responsible for the highest Ra values on side faces are reduced; valleys are partially filled; and the overall profile becomes more sinusoidal and less jagged. Importantly, this smoothing effect is most pronounced on the rougher surfaces (angled side walls) — which reduces the Ra differential between orientations more than it reduces Ra on already-smoother horizontal faces. The result is not just lower Ra but substantially less anisotropy.
4. Comprehensive Ra Data Table by Bead Grade, Size, and Process
All values below are for dry blast, suction-feed cabinet, PA12 SLS (100 µm layer, standard build parameters). PA11 values are within ±1 µm of PA12 at equivalent conditions.
| Bead Grade / Size | Pressure | Cycle | Horizontal Ra | Side Ra | Bottom Ra | Ra Anisotropy |
|---|---|---|---|---|---|---|
| ZrO₂ 0.05–0.10 mm | 48 PSI | 14 min | 3–5 µm | 5–8 µm | 4–6 µm | 2–3 µm |
| ZS 0.05–0.10 mm | 45 PSI | 16 min | 3–6 µm | 5–9 µm | 4–7 µm | 2–3 µm |
| ZrO₂ 0.10–0.15 mm | 55 PSI | 9 min | 4–6 µm | 5–9 µm | 4–7 µm | 1–3 µm |
| ZS 0.10–0.15 mm | 52 PSI | 10 min | 4–7 µm | 6–10 µm | 5–8 µm | 2–3 µm |
| ZS 0.15–0.25 mm | 62 PSI | 7 min | 6–10 µm | 8–13 µm | 6–11 µm | 2–4 µm |
| ZS 0.25–0.35 mm | 68 PSI | 5 min | 9–14 µm | 11–17 µm | 9–15 µm | 2–4 µm |
| Glass 0.10–0.18 mm | 60 PSI | 8 min | 6–12 µm | 9–16 µm | 7–13 µm | 3–5 µm |
The glass bead row is included for direct comparison. Note the wider Ra ranges for glass beads, reflecting the higher variability in Ra output that results from glass bead degradation even within a single run as bead sphericity decreases.
5. Surface Uniformity Improvement: Beyond Absolute Ra Numbers
The most commercially significant outcome of ceramic bead blasting on SLS parts is often not the absolute Ra value achieved but the reduction in Ra anisotropy — the Ra difference between horizontal and side faces. This difference, which ranges from 8–12 µm as-built, drops to 2–4 µm after ceramic bead blasting across all bead sizes in the table above.
Why this matters commercially: buyers of SLS parts evaluate appearance quality visually. A part where the top face looks smoother than the side walls is visually obviously “not finished.” Even if both faces pass a Ra specification individually, a part where horizontal Ra = 8 µm and side Ra = 20 µm will look two-toned and unrefined. After ceramic bead blasting, a part where horizontal Ra = 7 µm and side Ra = 10 µm looks visually uniform — the 3 µm difference is imperceptible to the eye and touch, even though the absolute Ra values are not identical.
This is why ceramic bead blasting is described as providing a “uniform matte finish” on SLS parts rather than a specific Ra value — the uniformity is often the commercial deliverable, and it is achieved reliably across bead size and pressure settings in the production range.
6. Targeting Specific Ra Values: Parameter Control Guide
| Ra Target | Recommended Bead | Pressure | Cycle Time | Приложение |
|---|---|---|---|---|
| Ra 3–5 µm | ZrO₂ 0.05–0.10 mm | 45–52 PSI | 12–18 min | Premium appearance, fine-finish specifications |
| Ra 4–7 µm | ZS 0.10–0.15 mm | 48–56 PSI | 8–14 min | Appearance parts, pre-dye for light colours |
| Ra 6–10 µm | ZS 0.15–0.25 mm | 58–68 PSI | 5–10 min | Standard production, pre-dye for standard/dark colours |
| Ra 8–14 µm | ZS 0.20–0.35 mm | 62–72 PSI | 4–7 min | Functional parts where appearance is secondary; coarser dyeing |
Ra is a probabilistic output — it falls within a range rather than hitting a single value, because it depends on local part geometry, blast angle, and coverage uniformity. Specify Ra ranges in production documentation rather than single target values. A specification of “Ra 5–9 µm” is achievable and inspectable; “Ra exactly 7 µm” is not.
7. Ra Consistency Over Ceramic vs. Glass Media Lifetime
Ra output consistency over the service life of the blast media charge is one of the most important — and most often overlooked — factors in selecting between ceramic and glass beads for SLS depowdering.
| Тип носителя | Service Life (cycles) | Ra Drift Over Lifetime | Consistency Characteristic |
|---|---|---|---|
| Ceramic ZS | 1,500–2,500 | ±1–2 µm from qualification baseline | Gradual, predictable drift; stable for 80% of service life |
| Ceramic ZrO₂ | 2,500–4,000 | ±0.5–1.5 µm from baseline | Most stable Ra output of all media types |
| Стеклянные бусины | 400–800 | 3–6 µm upward drift over 300–600 cycles | Ra degrades as beads shatter and shift to angular population |
The practical consequence for SLS production: with glass beads, Ra monitoring becomes a daily task because drift can be rapid. Parts qualified at Ra 8 µm on a fresh glass bead charge may reach Ra 13 µm by the time the charge is halfway through its service life — a drift that may push parts out of Ra specification without any change in blast parameters. With ceramic ZS or ZrO₂ beads, Ra monitoring can be done weekly or monthly with far less risk of undetected out-of-specification production.
Full comparison of Ra consistency, recycling cycles, failure mode, and cost-per-part between ceramic and glass bead media.
8. Ra Measurement Protocol for SLS Depowdering QC
Consistent Ra measurement requires a standardised protocol so results are comparable across shifts, operators, and batches. The following protocol applies to contact profilometry (stylus instrument) on PA12/PA11 SLS reference coupons:
Standard Ra measurement protocol for SLS depowdering QC
- Instrument: contact profilometer (stylus tip radius 2 µm)
- Cutoff wavelength (λc): 0.8 mm (appropriate for Ra 2–12 µm per ISO 4288)
- Evaluation length: 4 mm (5 × λc = 4.0 mm is the standard evaluation length for λc 0.8 mm)
- Surface: flat reference coupon, horizontal build orientation (top face), sintered in each production build
- Measurement location: central zone of the flat reference face, avoiding edges (≥3 mm from any edge)
- Number of runs: minimum 3; report as mean ± standard deviation
- Frequency: once per production batch (once per build) at minimum
- Record: coupon ID, build date, bead grade, bead size, pressure, cycle time, media charge age, Ra mean ± SD
Do not measure Ra directly on production parts for routine QC — the profilometer stylus can leave a detectable scratch on clean blasted nylon surfaces, and complex part geometry prevents standardised measurement positioning. The reference coupon approach is reproducible, non-destructive to production parts, and creates a documented trend record that supports both process control and customer quality evidence requirements.
Часто задаваемые вопросы
With ZS beads at 0.15–0.25 mm and 60–65 PSI, PA12 SLS parts typically achieve Ra 6–10 µm on horizontal surfaces and Ra 8–13 µm on side surfaces. Stepping down to 0.10–0.15 mm at 50–58 PSI achieves Ra 4–7 µm horizontal and Ra 6–10 µm side. The finest Ra achievable with dry ceramic bead blasting is approximately Ra 3–5 µm using ZrO₂ beads at 0.05–0.10 mm — below this, wet ceramic bead blasting is needed, which can achieve Ra 3–5 µm at equivalent bead sizes due to the water-cushioned impact reducing peak surface stress.
This orientation-dependent variation is the staircase effect of layer-by-layer SLS sintering. Horizontal faces are the cross-section of each sintered layer and tend to be smoother — Ra 12–18 µm as-built for PA12. Side and angled faces expose the stacked layer edges at the layer pitch (typically 100–120 µm for PA12), creating visible stair-step texture at Ra 20–28 µm as-built. Ceramic bead blasting reduces both values significantly, and — crucially — reduces the Ra difference between orientations from 8–12 µm as-built to 2–4 µm post-blast, producing the visually uniform matte surface that professional SLS output requires.
Use a contact profilometer with a 2 µm radius stylus tip, cutoff wavelength λc = 0.8 mm, and evaluation length of 4 mm. Measure on a flat reference coupon sintered with each production build — on the horizontal top face at a defined central location, avoiding edges. Record the mean of at least 3 measurement runs. Do not measure directly on production parts for routine QC; the profilometer stylus leaves a detectable mark on clean blasted nylon and complex geometry prevents standardised positioning. The reference coupon approach is reproducible and non-destructive to production parts.
Yes — ceramic bead media (ZS or ZrO₂) maintains Ra output within approximately ±1–2 µm of the qualification baseline through 80% of its service life. Gradual drift is due to progressive bead size reduction through spherical attrition; smaller beads produce marginally lower Ra and require slightly longer cycles. Glass beads degrade much faster and less predictably, with Ra drifting 3–6 µm upward over 300–500 cycles as beads shatter into angular fragments. The Ra consistency of ceramic media is one of the primary commercial reasons professional SLS operations have replaced glass beads with ceramic — it enables less frequent Ra measurement and reduces the risk of undetected out-of-specification production.
Related Articles in This Series
Return to the Ceramic Beads for SLS Powder Removal — Complete Guide for the full overview.
The primary variable controlling Ra — complete size-to-Ra selection matrix.
How pressure adjustments shift Ra within the range set by bead size.
The companion quality metric to Ra — how blasting affects SLS part dimensions.
How wet blasting achieves 1–3 µm lower Ra than dry at the same bead size.
Why ceramic’s Ra consistency over media life is a key commercial differentiator.
How Ra level controls dye uptake depth and colour saturation in PA12/PA11 SLS.
Specify Ceramic Beads for Your SLS Surface Finish Target
Jiangsu Henglihong Technology Co., Ltd. supplies ZS and ZrO₂ ceramic blasting beads in ISO-classified sizes from 0.05 mm to 0.60 mm with full PSD documentation. Tell us your Ra specification and SLS material — we will identify the right bead grade and size and supply samples for first-article Ra qualification.
Request Samples & Ra DataФильтры